Tag Archives: television-ratings

Google TV is coming (and we told you so)
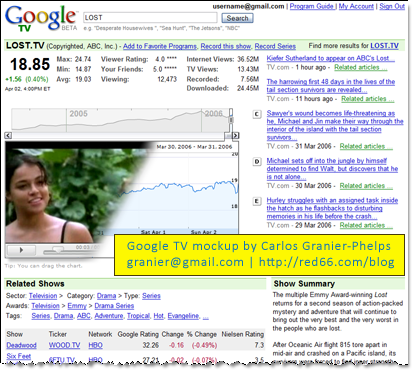
The New York Times (Google and Partners Seek TV Foothold) and Web TV Wire (Google TV On Way – Search Giant Teams With Intel & Sony For Android-Based Set-Top Box) are reporting that…

Google and Intel have teamed with Sony to develop a platform called Google TV to bring the Web into the living room through a new generation of televisions and set-top boxes. (NYT)

RED66 readers (yes, all three of you) got a glimpse of the future and already knew about this development four years ago, when I wrote about “Google Media.” Some choice quotes from that article:

Google has been quietly getting ready to bring the power of its brand and technology to the way you experience music, television and media in general.

Google has the equipment and expertise necessary to set up a massive media distribution and tracking network, integrated into their existing search and advertising technologies.

Google is also making inroads into the set-top box business, hoping to bring television media straight into your television (whether it’s in your living room or your mobile phone).

At the time I wrote that article (April, 2006) I made a mock-up of what a Google Media Dashboard could look like, based on their Google Finance interface. What do you think?

Google TV Dashboard

Read the original article here: Google Media.

And, as always, feel free to comment below and share it with your friends (hint: use the retweet button at the end of the article).

New Tools for Tracking NBC vs. CBS at YouTube

TubeMogul, the awesome online video traffic analysis tool, now (finally guys! 😉 ) offers embeddable charts, as well as a number of new social features.

Here’s the latest month of YouTube data for NBC and CBS, showing NBC’s continuous lead over rival CBS.

I’ve set the chart to show data from May 13 to Jun 12, 2007 – but you could just as easily set it to continuously auto-update and show the last thirty days.

TubeMogul – Empowering Online Video.

Two Interesting Articles from Advertising Age

Advertising Age has a couple of interesting articles today:

Ad Age Digital

User-Generated Video Gets Its Own TV Channel

According to this article, Fame TV is a new channel dedicated entirely to consumer-generated videos, airing on the BskyB satellite network in the UK and Ireland. Users can upload their videos for a $3 fee -there’s also a deal with Revver for content- and these will be aired using an innovative format: nine boxes will be on the screen at all times, each one showing a different video. Each box has a code so that viewers can vote via SMS for their favorite show. In the case of Revver videos, Revver will pay a percentage of the SMS revenues to each video creator.

I’m assuming that videos getting lots of SMS votes, will be aired more often to create even more revenue. Judging from the success of shows like “America’s Funniest Videos,” the success of the idea seems guaranteed. It’ll make for a great time-waster and sure beats channel surfing.

It will initially lack advertising, though a good idea would be to run advertising in the center box (an even better idea would be to user-generated advertising, a la CurrentTV’s V-CAM (Viewer Created Ad Messages)).

Locally, this would be a great idea for networks to fill an hour or two of late night infomercial infested air time.

and the other article is:

Ad Age Media Works
Why TV Needs Commercial Ratings — Now

CBS‘ Chief Research Officer, David F. Poltrack, explains in great detail why it’d be smart for the television networks to measure ratings by the number of people watching commercials instead of the number of people watching the shows.

While this may sound counterintuitive at first, he gives a detailed explanation oh what’s happening with DVRs. Viewers are increasingly using DVRs to watch TV shows at their convenience. As I’ve previously mentioned here, network competition is moot when you can record both competing shows and watch them both at a later time.

When viewers have a DVR, more of them watch the shows after the fact than live. And about 40% of these viewers actually watch the commercials. Well, according to Poltrack, these eyeballs are not being counted, since the current system relies on live viewings (because advertisers automatically assume that DVR owners will fast-forward through their expensive commercials).

With the proper measuring system in place, viewers who watch the ads will be accounted for, while those who skip them won’t. Sounds fair to me, but go read the whole article… recommended.

Technorati Tags: , , , ,

Rethinking Ratings

Summary: An analysis of current television ratings methods, why they’re inappropriate for the timeless internet and digital video recorder era, and suggestions for improving them.

Traditional television ratings reports let TV executives and analysts study the behavior of a particular show or series, displaying the number of viewers each show had, broken down by demographic targets. This allows the television industry to determine which show won a particular time slot (e.g., Friday 9pm to 10pm), how it performed among a particular demographic (e.g., Males 18-34yrs) and how it has evolved (in the case of serials) over time (e.g., Are there more or less people watching it).

But what happens when viewers can watch any show at any time? When viewers don’t have to choose one show over another on a rival network? What happens when you can’t tell for sure who your viewers are?

The internet and TiVos give the viewer unprecedented freedom over when, where and what to watch. Soon it won’t be possible to tell for sure how many people are watching any given show, using traditional ratings tools such as AGB/Nielsen‘s Peoplemeters. Programming executives won’t have to worry about what the rival networks are showing at the same time as their new hit show. And ratings analysts won’t be able to track a new series’ behavior by simply looking at how each episode did on its air date.

Two hit shows going head-to-head on rival networks? Not a problem: watch one and record the other for later viewing (or get it from the Net). Missed last week’s premiere episode? No problem there either: watch it online, download it off bit torrent or pay for it on iTunes. Some of this you can easily track, but some you can’t.

Analysts will need to track each episode over time and then track the series as a whole. A VERY SIMPLIFIED graphic might look something like this, with a running total for each episode over the time of the series:

VERY simple ratings graphic

Any viewer can watch any episode from its air date to the end of the series (and beyond). This allows viewers to catch-up after the series has started or to catch any episode they may have missed. Of course, the whole concept of missing an episode disappears in the TiVo/Internet model. But in addition to tracking how many times a particular episode was watched or downloaded, you should also be tracking what’s happening with the rest of the show’s internet presence. Are viewers reading the characters’ blogs? Are they discussing the show in the forums? Are they setting up fan websites? Linking to the Myspace profiles? Uploading mashups of show clips? Not only must you track the show’s behavior over time and over several distribution methods, but you must also track and measure the user experience surrounding the show.

And finally, how do you solve the demographic problem: if you don’t know who your viewers are, how do you target them? The answer is both simple and complex. I believe that traditional demographic targets are on the way out. Social networks and special interest groups are the new targets… and these are much easier to track via the Internet than the old ones. You may not be able to tell whether a particular viewer is male or female, young or old, wealthy or not, but you can tell what news s/he reads, what games s/he plays and which people s/he hangs out with (to a certain degree, of course). One minor detail… you can’t (or shouldn’t) add apples and oranges. Traditional television ratings data categorizes viewers by demographic targets such as age, sex, location and income (because someone takes the time to visit each household in the sample and verify this information). And whereas traditional ratings analysis has always relied on a sample set of data subjects, internet traffic and behavior analysis has always examined the whole dataset. Eventually it shouldn’t be too hard to homogenize both sets of data, either by linking traditional television viewers to their online behaviors, or simply by expanding their interviews to include enough data to categorize them.

Currently, Google and YouTube limit their video data to a traditional web-traffic analysis mindset: most viewed, most recent, most subscribed. Coming from an Internet world, they fail to see the need (or maybe even the possibility) of better, more detailed reports (Yes, it could also be that they keep these reports hidden from the outside world).

As for me, I’d love to know how the most watched videos on YouTube evolved over time. Have they peaked? Are they growing? Who watches them? How about a Google Finance like chart, linking views to blog/news mentions? Which video has been linked-to the most (this one is actually on YouTube)? Which videos have been dugg and how many diggs did they get? Actually… I’d just love to work there and get it done myself!